Creating a custom dashboard in Google Analytics
James Edward Anthony
Content Writer
Custom Dashboard in Google Analytics Custom dashboard in Google Analytics allows you to group your reports so you can see anything that you would want to report to in one place. This could be to see all related reports in one place, such as a social media dashboard that tells you more about the visitors [...]
Custom Dashboard in Google Analytics
Custom dashboard in Google Analytics allows you to group your reports so you can see anything that you would want to report to in one place. This could be to see all related reports in one place, such as a social media dashboard that tells you more about the visitors coming from social media platforms to your website. This could also be a dashboard for a specific function such as a weekly report dashboard that has all the numbers that you report on in one place.
Let's build a custom dashboard in Google analytics!
In this example, I am going to build a social media dashboard that shows you all your visitors that are coming from social media in one place.Firstly you will need to go to Google Analytics, Dashboards, and select Create. You will be asked if you would like a blank canvas or a starter dashboard. You are going to select a blank canvas. Click on create a dashboard.In the top left-hand corner, you are going to need to select a new widget.In this widget, we are wanting to show the number of users that have come from social media in the given time frame. By default, the widget will open with Metric selected. We are going to want to leave this selected as we want to show the actual number of users. Under, Show the following metric: you are going to need to select Users then add a filter. By default, Only Show will be selected you can leave this selected. In the dimension field, you will need to search for Social Source Referral. Change the field Containing to Exact Match and in the text box type Yes.
The definition of Social Source Referal is: Whether or not this activity resulted from a social source.
Click Save. You now should be showing, as a number, users from social sources.
Furthermore, you can follow the same process as above and build additional widgets for this dashboard.
- Users from social by country - Map
- Users by social network - Pie
- Sessions & bounce rate from social - Timeline
- Sessions & bounce rate - Table
Need further help?!
Digital Lime Green is well-equipped to provide you with further assistance regarding your queries. Need to chat with us? Feel free to connect with us through the portal! We wish you good luck in your endeavours!
More articles
View all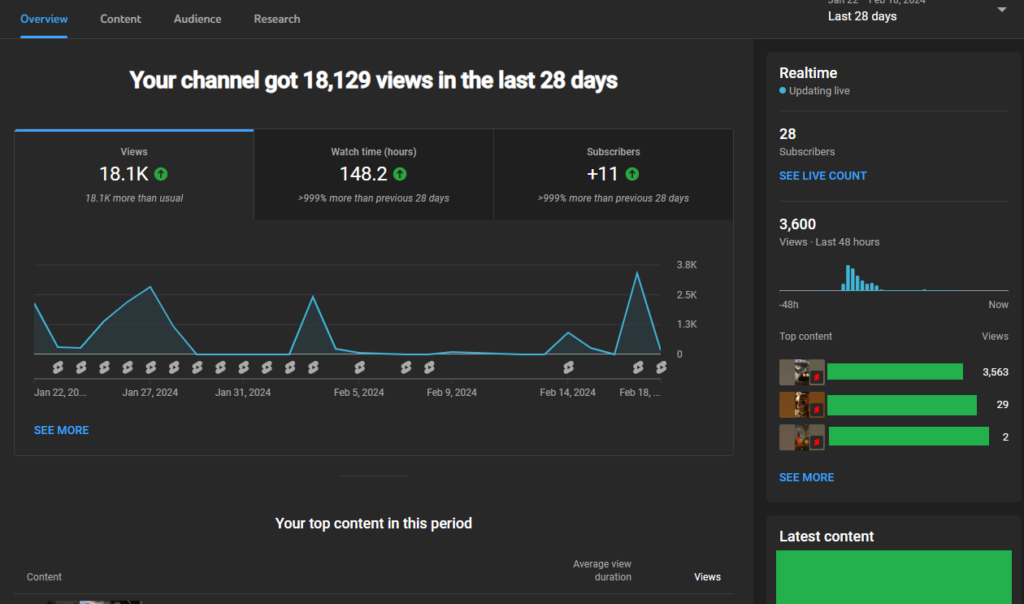 How-to
YouTube Studio Analytics | See Your Videos Perform in Cape Town!
Previously, we talked about YouTube Studio's Dashboard, which is an overview of your channel's performance. Now, let's talk about the Analytics tab in the YouTube studio. Understanding YouTube Studio performance analytics can help you grow your channel in the right direction in Cape Town. In this article, we will see the different statistics YouTube Studio [...]
Read more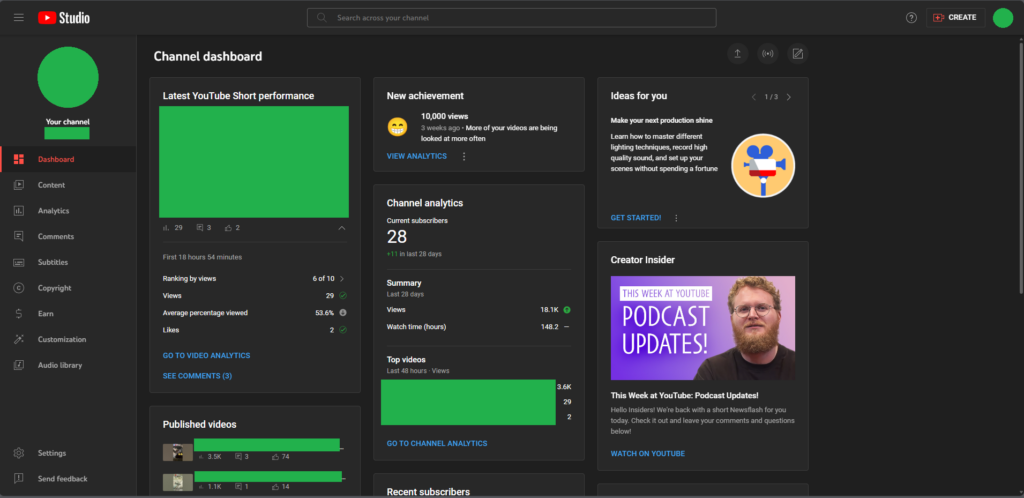 How-to
Let’s Understand the YouTube Studio Dashboard! | Cape Town
YouTube Studio is a great way to keep tabs on your videos. Whether it is about gathering analytical data or managing your content, YouTube Studio provides an effective solution by delivering detailed insights into your videos. As YouTube is getting popular in 2024, many South African youth consider trying their hand at YouTube. In this [...]
Read more How-to
Effective SEO Methods for Small Businesses in South Africa
Local businesses have been booming post-pandemic, thanks to the digital realisation. Having a website has become crucial ever since. However, having a website for your business does not mean it will attract business right off the bat. You have to get the SEO (Search Engine Optimisation) right to maximise your website's efficiency. In this article, [...]
Read more